Crunchbase is a platform that provides information about private and public companies, including investments and funding details. In other words Crunchbase is a great resource for acquiring data about companies.
I was interested in learning about the types of companies that get funded in the Bay Area, and what level of success they achieve.
While we could measure success a number of ways, Crunchbase provides easy access to funding totals and status (acquired, ipo, operating, closed). Clearly this does not provide a complete picture of a company's success, for example a company with moderate funding that has not been acquired or had an ipo might just be a young company who's success is yet to be determined. Moreover, companies with the same funding totals and status might even have vastly different revenues and profits.
Nevertheless status, funding and year founded seem like a good starting point to give us a macro view of the Bay Area landscape in a short amount of time.
In order to build the following visualizations I created a Tableau dashboard containing all of the funding data for Bay Area companies.
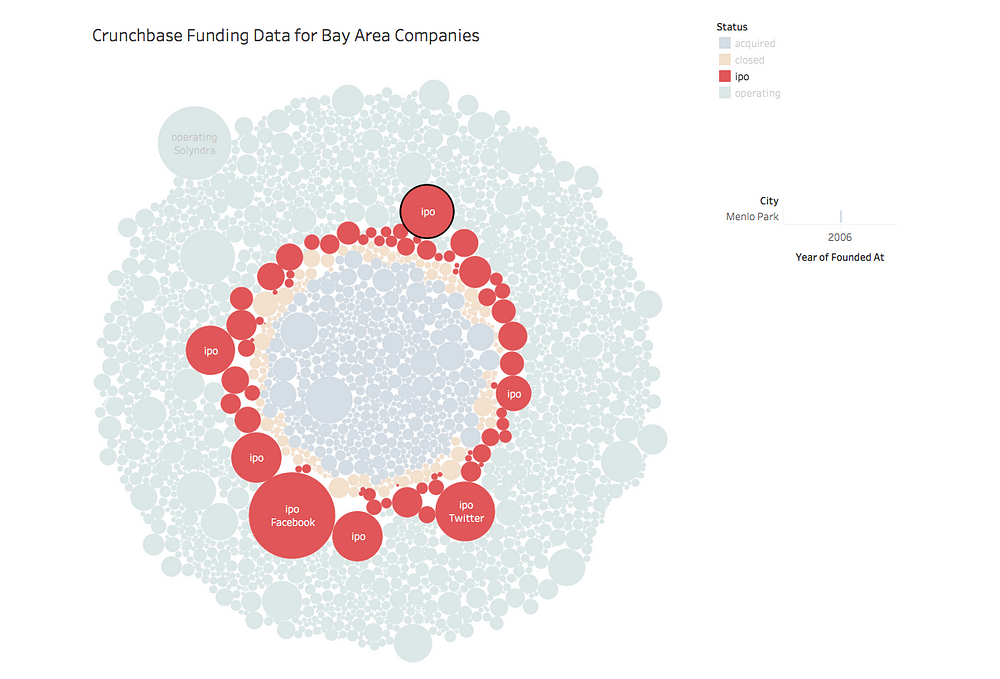
By clicking on status you can highlight all the companies with that status. Above we have highlighted all the public companies.

Each bubble represents a company. By hovering over a bubble you can see its category, company name, and funding total. To the right you will see the city and year founded at displayed as well.
Let’s click on a company to get a detailed view that compares it to other companies in its category, as well as to other categories at the same time.
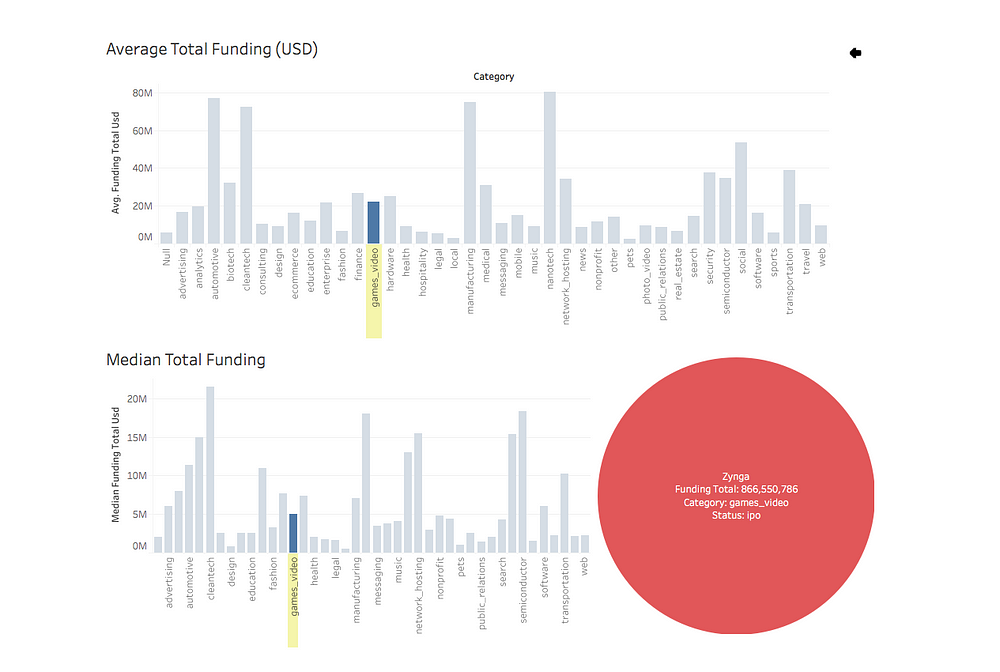
Zynga is a social game developer based in San Francisco, most known for the popular Facebook game Farmville. Here we see that Zynga received over four times the average total funding, and over 17 times the median total funding in the video games category.
In fact Zynga has been funded above the average funding for the automotive and manufacturing industries. If we were confused by this and wanted to learn more we could do some research to see why this is the case. In fact, VentureBeat has a good article on Zynga’s history.
As an important note, the bar charts above demonstrate just how far apart the median and mean can be. The respective medians and means for total funding in each category are extremely different. We might expect this for company funding because a few companies get funded at vastly higher amounts than the majority of companies. Since the mean is sensitive to ‘outliers’ we get a much higher mean than median.
We have outliers in quotes because companies that receive funding amounts far above average probably shouldn’t be considered outliers as they occur consistently across industries. Instead they should be thought of as extreme cases, but their effect on the mean is the same.
In fact if we really wanted to be careful about our analysis we would realize that when we are looking at the median and mean for each category we are including Zynga’s data. So when we say Zynga received over four times the average total funding, that is already including Zynga’s funding total which has inflated the mean. If we wanted to do a better comparison we might use a trimmed mean instead. To some degree the median takes care of this problem already, but it is good thing to watch out for if you were trying to directly compare Zynga’s funding total with the category’s average funding total as we did above.
There are many more interesting cases contained in the Tableau dashboard that I’ve published on Tableau Public. Check it out to see what you can learn about Bay Area companies!
Data was downloaded from Mode Analytic’s tutorial under the table crunchbase_companies and is only as accurate as the data that is provided there.