Where does logistic regression come from and why does it work for classification problems? In a naive approach if we wanted to predict two classes we could set one class to 0 and the other to 1 (it doesn’t matter which), then we could perform a linear regression and assign values less than .5 to the zero class and values at or above .5 to the ones class. Here we are treating the linear regression model as if it were providing us with some sort of probability when its not clear that it does. Worse our predicted values can be outside of the interval [0, 1] when a true probability couldn’t.
Logistic regression aims to address these issues. We want a function that will bound our results between zero and one and give us some properties that one might expect of a probability distribution.
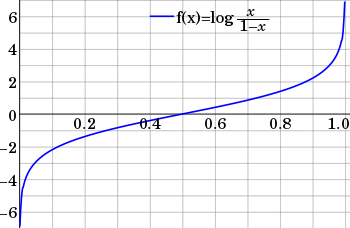
It so happens that log(x/(1-x)) will help us achieve the result we are looking for.
Instead of x we use p(x), where p(x) is a function that represents the conditionally probability of predicting the positive class given the negative class. We can make this function linear by doing the following.

We then solve for p(x) by rewriting the equation in exponential form and doing some basic manipulation.

So p(x) can actually be described by what is known as the sigmoid function.

This function gives us the results we are looking for! Our output is on the interval (0, 1) and while this is not the same as [0, 1] we can get close enough to zero and one that it is functionally the same, plus this behavior is actually helpful.
How is it helpful? Well we said we wanted our function to behave as we might expect a distribution to behave. The asymptotes at zero and one give us the behavior that as our values become more extreme the change in probability becomes smaller. This is pretty informal but you might think of this via example. For instance, if you wash your hands each day you are less likely to get sick. However, increasing the number of times you wash your hands each day will result in diminishing returns to your probability of staying healthy after a certain number of washings. Someone who washes their hands 50 times a day is not significantly less likely to get sick than someone who washes 10 times.
This type of behavior is what we want from our probability distribution and presents a much better solution than using a linear regression classifier. Now we can assign predictions less than .5 to the negative class and at or above .5 to the positive class with the confidence that all our predictions will fall within the interval (0, 1).
This ends our basic introduction to the intuition behind logistic regression. We should keep in mind that so far we have only fitted our logistic regression to a simple linear regression, it is possible to extend this to multiple linear regression but the calculations are cleaner and easier to understand if we stick to simple linear regression.